Merrypopins














merrypopins is a Python library to streamline the workflow of nano‑indentation experiment data processing, automated pop-in detection and analysis. It provides five core modules:
load_datasets: Load and parse.txtmeasurement files and.tdm/.tdxmetadata files into structured pandas DataFrames. Automatically detects headers, timestamps, and measurement channels.preprocess: Clean and normalize indentation data with filtering, baseline correction, and contact point detection.locate: Identify and extract pop‑in events within indentation curves using advanced detection algorithms, including:- Isolation Forest anomaly detection
- CNN Autoencoder reconstruction error
- Fourier-based derivative outlier detection
- Savitzky-Golay smoothed gradient thresholds
statistics: Perform statistical analysis and model fitting on located pop‑in events (e.g., frequency, magnitude, distribution). The statistics module allows you to compute detailed pop-in statistics, such as:- Pop-in statistics (e.g., load-depth and stress-strain metrics)
- Stress-strain transformation using Kalidindi & Pathak. (2008)
- Curve-level summary statistics (e.g., total pop-in duration, average time between pop-ins)
- Pop-in shape statistics like depth jump, average velocity, and curvature
make_dataset: Construct enriched datasets by running the full merrypopins pipeline and exporting annotated results and visualizations.
🌐 Try Merrypopins Library Online
🚀 Live demo: explore Merrypopins in your browser!
The hosted app lets you:
- upload raw
.txtindentation files (and optional.tdm/.tdxmetadata), - tune preprocessing, detection & statistics parameters,
- visualise pop-ins interactively,
- download annotated CSVs + plots.
🛠 Source Instrumentation
Merrypopins was developed using datasets generated by the Bruker Hysitron TI 990 TriboIndenter — a high-precision nanoindentation platform. The library natively supports .txt and .tdm/.tdx file formats exported by the Hysitron software suite.
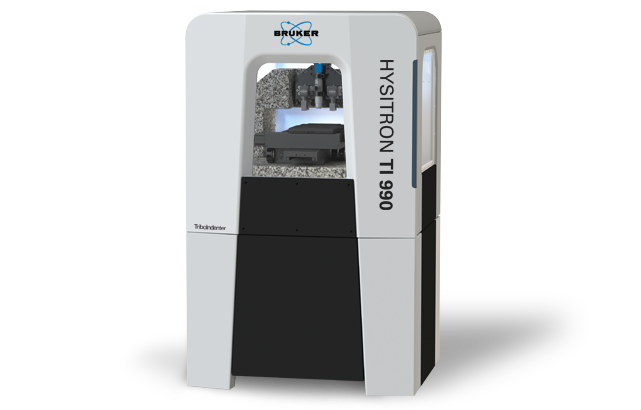
Typical indentation experiments conducted with the TI 990 include:
- Force-depth curve acquisition at nano/micro scale
- High-resolution pop-in event detection
- Automated test grid data export
The preprocessing and pop-in detection tools in Merrypopins are tuned to handle the structural patterns and noise profiles specific to these datasets.
Example: Nanoindentation Grain Selection and Deformation
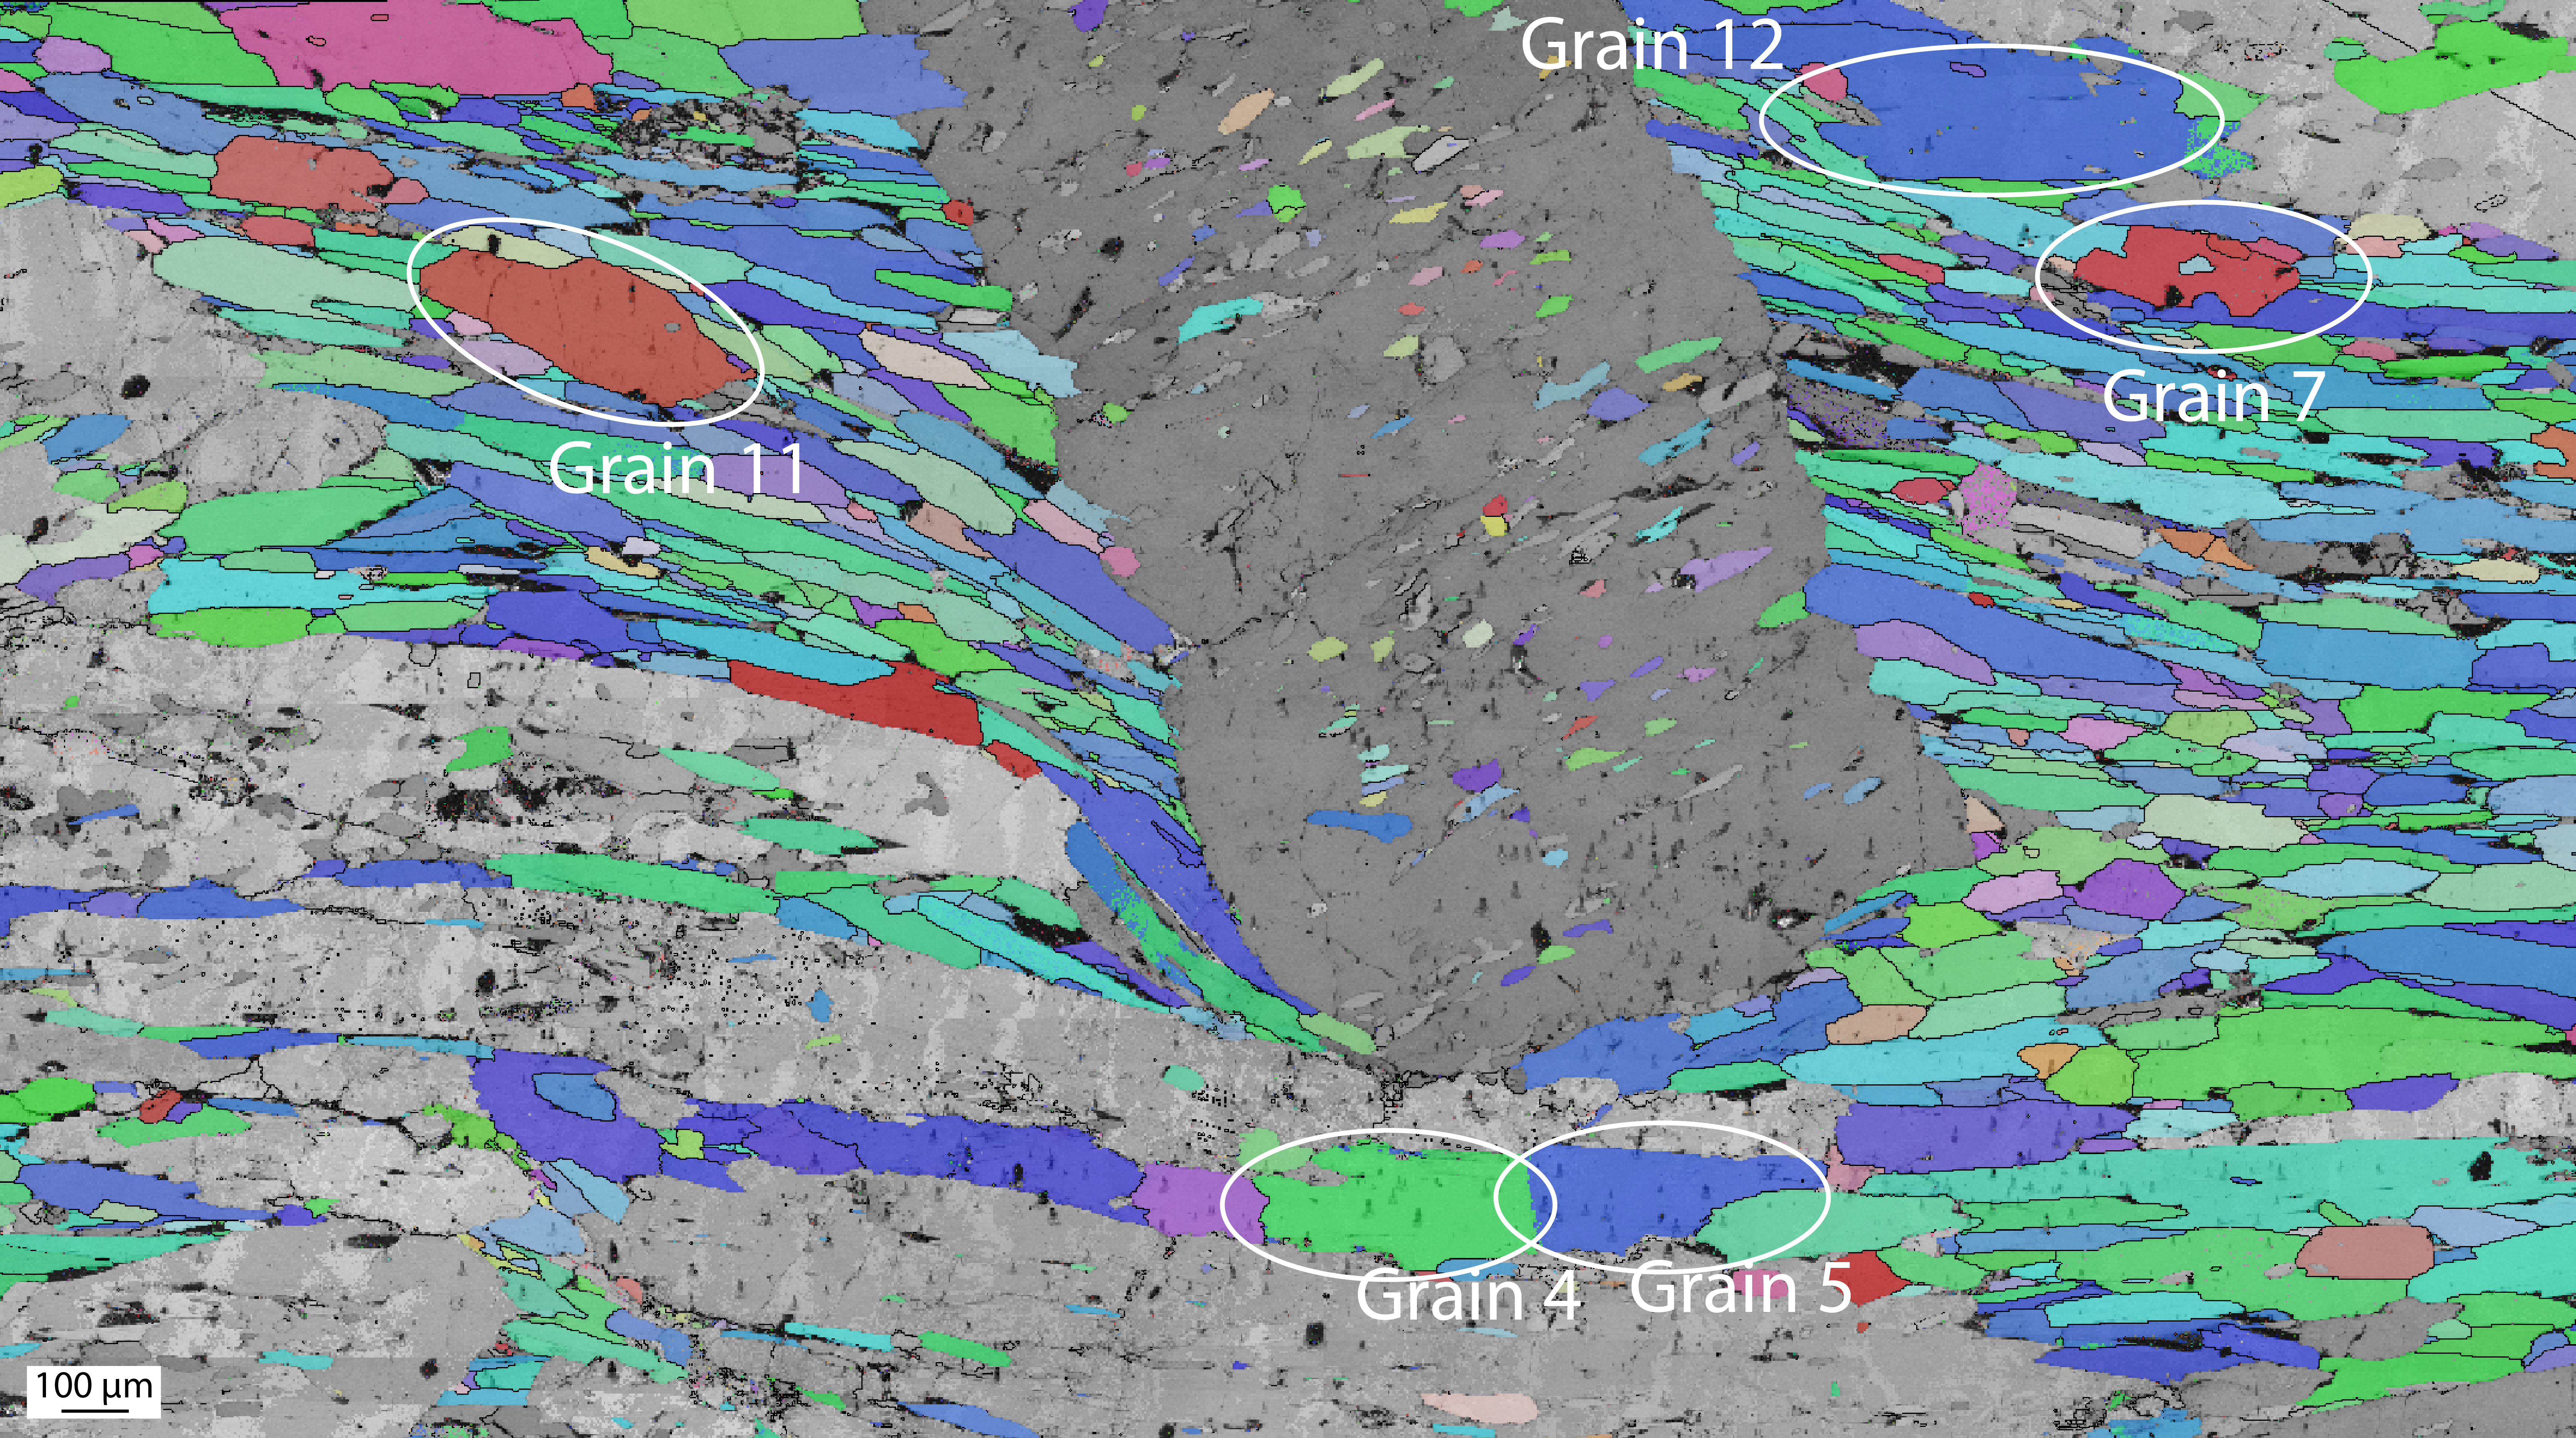
Below are example visualizations from Electron Backscatter Diffraction (EBSD) maps used to select grain areas, followed by indentation marks after testing:
➤ Pre-indentation EBSD with Labeled Grains
➤ Post-indentation Microstructure with Deformation (Area on Grain 5)
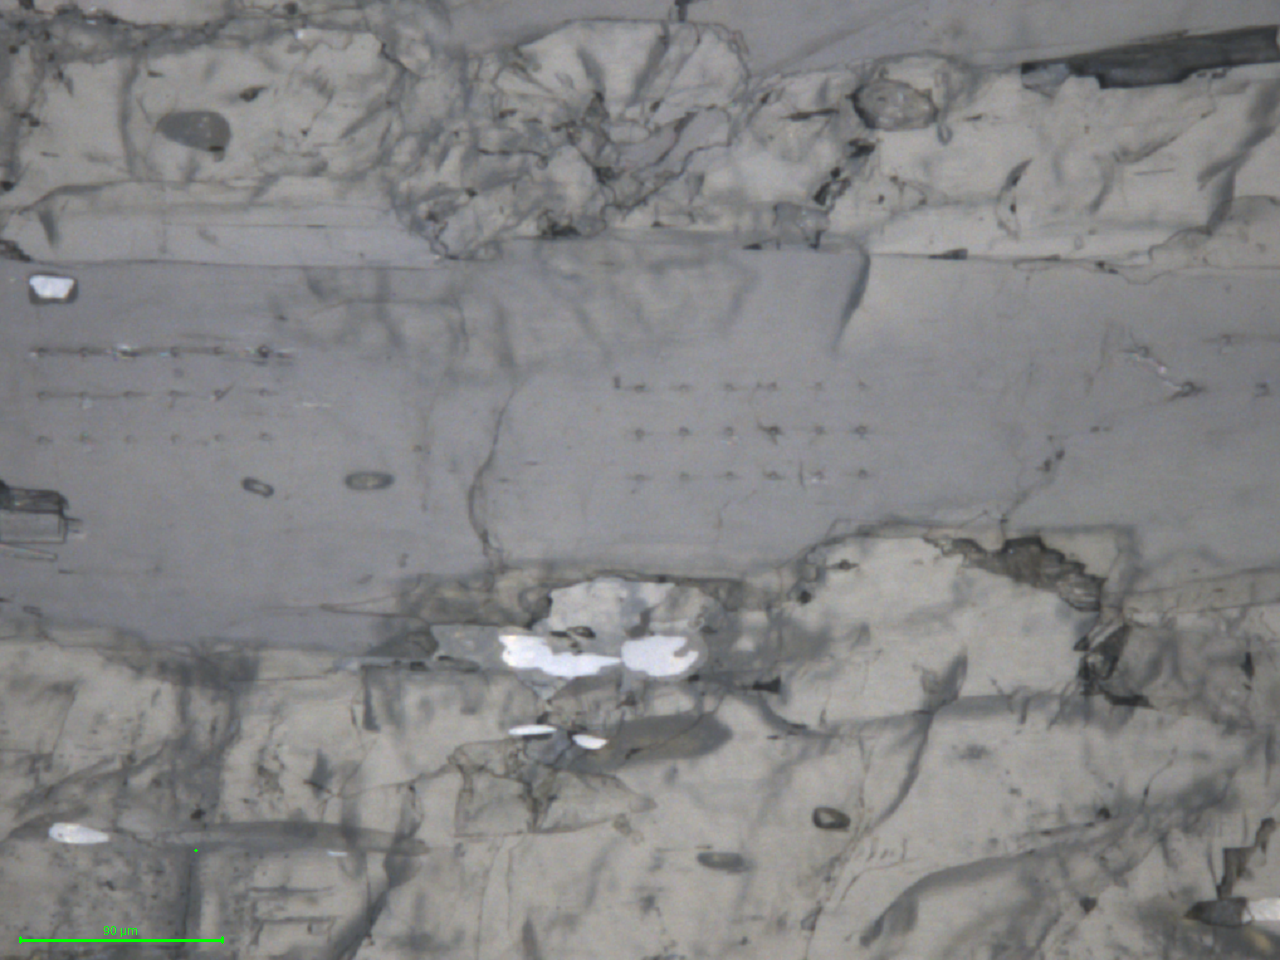
These images highlight the complex deformation behavior analyzed by the merrypopins toolset for robust pop-in detection.
For a quick overview, see the Quickstart.
Merrypopins is developed by Cihat Acar, Anna Marcelissen, Hugo van Schrojenstein Lantman, and John M. Aiken.
🔄 Workflow
The five modules form a pipeline. Each stage takes the DataFrame the previous stage produced, so you can stop anywhere, inspect the result, or swap in your own step.
flowchart LR
    RAW[".txt curve<br/>.tdm/.tdx metadata"] --> LOAD["<b>load_datasets</b><br/>parse to DataFrame"]
    LOAD --> PRE["<b>preprocess</b><br/>trim, find contact,<br/>zero the depth axis"]
    PRE --> LOC["<b>locate</b><br/>four detectors +<br/>agreement score"]
    LOC --> STAT["<b>statistics</b><br/>stress-strain, yield point,<br/>precursor & temporal stats"]
    STAT --> OUT["annotated tables,<br/>summary stats, plots"]

    subgraph WRAP["make_dataset.merrypopins_pipeline (convenience wrapper)"]
        LOAD
        PRE
        LOC
    end
make_dataset.merrypopins_pipeline runs the first three stages end to end on a single
file and writes an overlay plot, which is the quickest way to check a curve.
🔎 Choosing a detection method
locate offers four detectors. They are complementary rather than interchangeable:
the two derivative methods are cheap and predictable, and the two unsupervised
learning methods adapt to data whose pop-in sizes you do not know in advance.
| Method | Function | How it flags a pop-in | Main parameters | TensorFlow | Cost | Suits |
|---|---|---|---|---|---|---|
| Savitzky-Golay | detect_popins_savgol |
Polynomial-smoothed derivative of load, thresholded in standard deviations | window_length, polyorder, threshold |
no | very low | A first pass over a large batch; smooth, low-noise curves |
| Fourier derivative | detect_popins_fd_fourier |
Derivative taken in the frequency domain, thresholded in standard deviations | threshold, spacing |
no | very low | Sharp discontinuities, with almost nothing to tune |
| Isolation Forest | detect_popins_iforest |
Unsupervised outlier detection over (stiffness difference, curvature) | contamination, window |
no | low | Curves where pop-in size and frequency are not known beforehand |
| CNN autoencoder | detect_popins_cnn |
Reconstruction error over sliding windows of the same two features | window_size, epochs, threshold_multiplier |
yes | high | Noisy curves and subtle nonlinear signatures a fixed threshold misses |
Neither learning method uses pre-trained weights. Both are fitted, unsupervised, on the curve you pass in, so no labelled training data is needed and results depend only on that curve and your parameters.
default_locate runs the enabled methods and combines them into three columns:
| Column | Meaning |
|---|---|
popin |
Any enabled method fired here (the inclusive union). Highest recall. |
popin_score |
How many methods fired here, i.e. how strongly they agree. |
popin_confident |
At least two methods agree. Use this when a false positive costs more than a missed event. |
Comparing popin_score across methods is also a cheap self-consistency check: events
that only one detector sees are worth inspecting on the overlay plot before you trust them.